Overview

Pennsylvania College of Technology
Williamsport, PA, USA
Public
4 Year
Overview
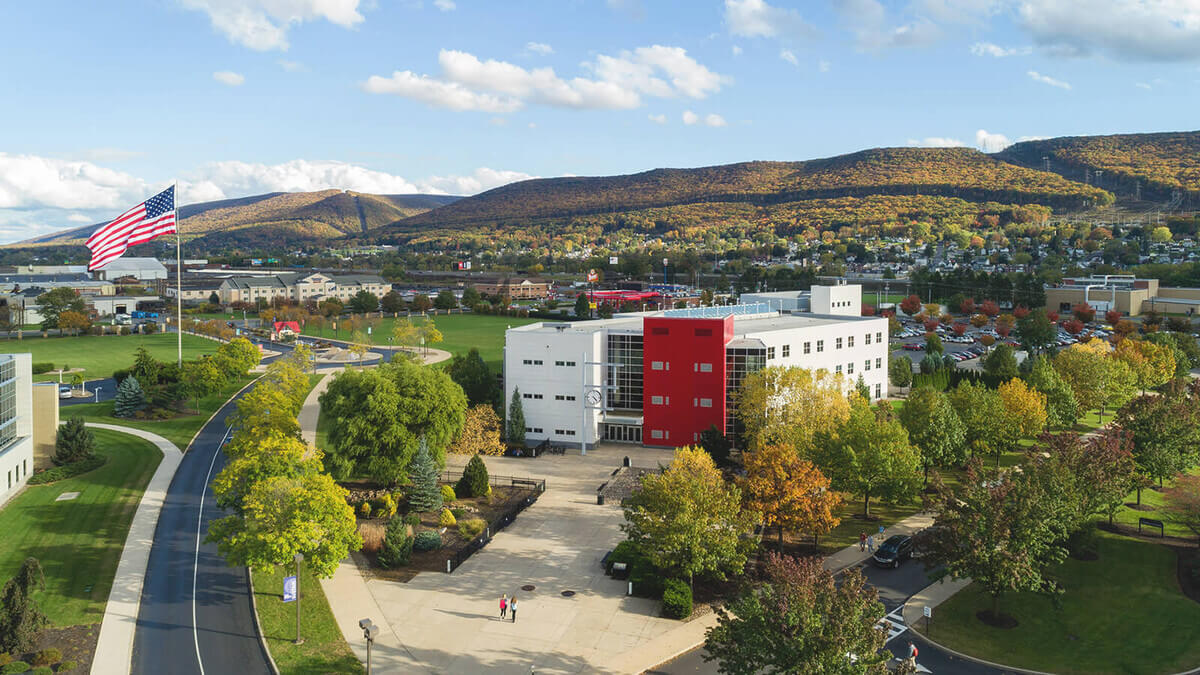
Pennsylvania College of Technology is an applied technology college and part of the Pennsylvania State University system. Penn College operates a main campus in Williamsport, PA, as well as four satellite campuses in the northern region of the state, including an aviation center. Penn College’s School of Business & Hospitality operates a casual fine-dining restaurant on campus where students at the school receive real-world training. A majority of students choose to study nursing, automotive mechanics, or dental hygiene.
Acceptance Rate:
80%
Average Net Price:
$25,794
Campus Setting:
Small city
Average GPA
3.1
Tuition, Cost & Aid
Affordability & Cost
Average Net Price
$25,794
Discover how military service can help you pay for college
Explore Military PathwaysTuition
| In-State Tuition In-state tuition is the tuition charged by institutions to those students who meet the state's or institution's residency requirements. In-district tuition is the tuition charged by the institution to those students residing in the locality in which they attend school and may be a lower rate than in-state tuition if offered by the institution. | $17,940 |
| Out-of-State Tuition Out-of-state tuition is the tuition charged by institutions to those students who do not meet the state’s or institution’s residency requirements. Out-of-district tuition is the tuition charged by the institution to those students not residing in the locality in which they attend school. | $25,680 |
Additional Costs
Room and Board The weighted average for room and board and other expenses is generated as follows:
| $12,314 |
| Books and Supplies | $1549 |
Average Net Price By Family Income
Income
Average Amount
< $30k
$19,399
$30k - $48k
$20,272
$48k - $75k
$24,043
$75k - $110k
$26,712
$110k+
$29,254
Financial Aid: visit page
Financial Aid Email: [email protected]
Aid & Grants
0
100
24%
Need Met
Students Receiving Gift Aid Percent of undergraduate students awarded federal gift aid. Federal gift aid includes any grant or scholarship aid awarded, from the federal government, a state or local government, the institution, and other sources known by the institution. Students Receiving Grants Percent of undergraduate students awarded grant aid. Grant aid includes any grant or scholarship aid awarded, from the federal government, a state or local government, the institution, and other sources known by the institution.
33%
Average Aid Per Year
$7,254
33%
Average Federal Grant Aid Per Year
$5,065
Average Institution Grant Aid Per Year
$4,226
Students receiving state aid Students receiving federal aid
34%
Average State Grant Aid Per Year
$3974
31%
Average Federal Grant Aid Per Year
$5,065
Total Needs Based Scholarships/Grants Total amount of grant or scholarship aid awarded to all undergraduates from the federal government, state/local government, the institution, and other sources known to the institution.
$16,903,160
Student Loans
Students Borrowing Loans Loans to students - Any monies that must be repaid to the lending institution for which the student is the designated borrower. Includes all Title IV subsidized and unsubsidized loans and all institutionally- and privately-sponsored loans. Does not include PLUS and other loans made directly to parents.
67%
Average Loan Amount Per Year
$11,700
Average Debt at Graduation The median federal debt of undergraduate borrowers who graduated. This figure includes only federal loans; it excludes private student loans and Parent PLUS loans.
$15,000
Median Monthly Loan Payment The median monthly loan payment for student borrowers who completed, if it were repaid over 10 years at a 5.05% interest rate.
$222
Students receiving federal loans
64%
Average Federal Loans Per Year
$5,194
Average Other Loans Per Year
$18,406
Admissions
Key Admissions Stats
Institution Type
Public
- Not for Profit
- Coed
Need Blind
This school does not consider an applicant’s financial situation when deciding admission
Level of Institution
4 Year
Campus Setting
Small city
5772
Students Applied
72%
Transfer Acceptance Rate
314
Transfer Students Admitted
Admissions Requirements
SAT
No
ACT
No
Transcript
Yes
Test Optional
Yes
SAT Subject Tests
Yes
AP Course Credit
Yes
Dual Enrollment
Yes
Important Deadlines
| Application Type | Application Deadline | Reply Deadline |
|---|---|---|
| Fall Regular Decision | July 1 | July 1 |
| Spring Regular Decision | December 10 |
Applications Accepted
Admitted Student Stats
In-State Students
88%
Out-Of-State Students
11%
3.1
Average GPA
Students Enrolled By Class Rank
Top 10%
3
Top 25%
19
Top 50%
50
Students Enrolled By Household Income
< $30k
122
$30k - $48k
75
$48k - $75k
104
$75k - $110k
118
$110k+
187
Admissions Resources
For International Student Services: visit page
For Students with Disabilities: visit page
For Veteran Services: visit page
Academics
Key Academic Stats
Highest Degree Offered
Master's
Total Number of Students
4,241
Total Number of Undergrads
4,234
0
100
42%
Graduate in 4 Years US National: 28%
0
100
55%
Graduate in 6 Years US National: 52%
Student:Faculty Ratio
14:1
US National: 21:1Non Traditional Learning
- Online Classes
- Online Undergrad Degrees
- Summer Sessions
- Combined Institution Double Degree Programs
- Some Programs Requires Co-Op/Internship
Learning Options
- ROTC Army
- Study Abroad
Classroom Sizes
2-19 Students
62%
20-39 Students
37%
Degrees and Majors
MAJORS
87
Majors
| A B M D | |
|---|---|
| AGRICULTURAL/ANIMAL/PLANT/VETERINARY SCIENCE AND RELATED FIELDS | |
| ARCHITECTURE AND RELATED SERVICES | |
| BUSINESS, MANAGEMENT, MARKETING, AND RELATED SUPPORT SERVICES | |
| COMPUTER AND INFORMATION SCIENCES AND SUPPORT SERVICES | |
| CONSTRUCTION TRADES | |
| CULINARY, ENTERTAINMENT, AND PERSONAL SERVICES | |
| ENGINEERING | |
| ENGINEERING/ENGINEERING-RELATED TECHNOLOGIES/TECHNICIANS | |
| FAMILY AND CONSUMER SCIENCES/HUMAN SCIENCES | |
| HEALTH PROFESSIONS AND RELATED PROGRAMS | |
| HOMELAND SECURITY, LAW ENFORCEMENT, FIREFIGHTING AND RELATED PROTECTIVE SERVICES | |
| LIBERAL ARTS AND SCIENCES, GENERAL STUDIES AND HUMANITIES | |
| MECHANIC AND REPAIR TECHNOLOGIES/TECHNICIANS | |
| MULTI/INTERDISCIPLINARY STUDIES | |
| NATURAL RESOURCES AND CONSERVATION | |
| PARKS, RECREATION, LEISURE, FITNESS, AND KINESIOLOGY | |
| PRECISION PRODUCTION | |
| PUBLIC ADMINISTRATION AND SOCIAL SERVICE PROFESSIONS | |
| TRANSPORTATION AND MATERIALS MOVING | |
| VISUAL AND PERFORMING ARTS |
Faculty Overview
Gender
Male
Female
US National: 42%
US National: 48%
Ethnicity
African American
Asian/Pacific Islander
White
Hispanic
Unknown
Campus Life
Key Campus Stats
Student Gender
Male
Female
64%
US National: 44%36%
US National: 56%Residency
In-State Students
88%
Out-Of-State Students
11%
Size of Town
Small city
US States Represented
27
Countries Represented
12
Ethnicity
African American
4%
Asian/Pacific Islander
2%
Hispanic
5%
White
86%
Multiracial
3%
Unknown
1%
Percent of First Generation Students
36%
Student Organizations
56
LGBTQIA Student Resource Groups
Yes
On Campus Women's Center
No
Cultural Student Resource Groups
No
Housing
0
100
30%
Undergrads Living on Campus
On-campus living required of freshman
No
Disability Housing Available
No
0
100
28%
Freshman Living on Campus
Athletics
Divisional Sports Nickname
Wildcat
School Colors
blue and gray
Varsity Athletics Association
NCAA
Varsity Athletics Conference Primary
Not applicable
Total Male Athletes
128
Total Female Athletes
81
Intramural Sports
17
Sports Club
9
Sports Team (Men)
- Baseball
- Basketball
- Cross Country
- Golf
- Soccer
- Tennis
- Wrestling
- Archery
Sports Team (Women)
- Basketball
- Cross Country
- Soccer
- Softball
- Tennis
- Volleyball
- Archery
Pennsylvania College of Technology Athletics: visit page
Campus Safety
24-HR security patrol
Yes
Campus emergency phones
Yes
24-HR escort safety rides
Yes
Mobile campus emergency alert
Yes
After Graduation
Post Grad Stats
Average Salary
6 years after graduation
$46,100
Top 5 Cities
Williamsport
Philadelphia
Harrisburg
Scranton
State College
Top 5 Employers
Pennsylvania College of Technology
UPMC Susquehanna
Geisinger
Penn State University
Weis Markets
Top 5 Sectors
Operations
Engineering
Healthcare Services
Information Technology
Business Development
Average Debt at Graduation The median federal debt of undergraduate borrowers who graduated. This figure includes only federal loans; it excludes private student loans and Parent PLUS loans.
$15,000
Loan Default Rate
8%
National: 8%
Median Monthly Loan Payment The median monthly loan payment for student borrowers who completed, if it were repaid over 10 years at a 5.05% interest rate.
$222
REVIEWS
Read What Students Are SayingThis schools professors know what they're talking about. I have learned a lot in just my first semester! Every major has a ton of hands on training.
Kyle from Sunbury, PA
Never go a day without homework in one of classes
Amber from Philadelphia, PA
I AM DEFINITELY LEARNING MORE THAN I COULD HAVE IMAGINED. THE WELDING CLASSES AND WELDING THEORY ALONG WITH THE CNC PROGRAMMING AND ROBOTICS REALLY HELP ME TO SEE WHAT KIND OF FUTURE I MAY CONSIDER.
Patrick from Amesbury, MA
As a Penn College student I am learning a lot, practically a lot more than what I did know, by learning hands on. With great college professors they're willing to help you learn even better in and out of the class room.
Jennifer from Berwick, PA
I am pleased with my experience. The instructors are knowledgable and eager to help. I plan to continue attending.
Travis from Williamsport, PA
I love all of my teachers here, they makes it easier to learn but at the same time make it FUN for all! Love this place, so easy to get around also.
Cristina from Cochranton, PA
You can tell the teachers really care about students; a lot of them will go above and beyond to help you succeed.
The small class sizes allow you to ask questions and interact with classmates; the professor actually knows your name and it's just a really friendly learning environment.
There are always tons of events going on around campus, which offers great opportunities to new students to meet friends!
The small class sizes allow you to ask questions and interact with classmates; the professor actually knows your name and it's just a really friendly learning environment.
There are always tons of events going on around campus, which offers great opportunities to new students to meet friends!
Amanda from Lititz, PA
this college is one of the best colleges out there for some one who is not to excited to go back to school. this school has short corse. it is an amazing place every one is extremely nice and you really do learn about what you love.
Joseph from Zelienople, PA
i love the small classes. i love the attention given by each professor. and the food isn't bad either! :)
Camara from Lehighton, PA
I came to this college with already 3 years of vocational experience in my major and 2 years of work experience. Starting my first class year I was already learning things that I have never knew before or we went into more depth on those fuzzy subjects that never really stuck. Now being 2 years into my degree I'm constantly learning new things. I'm a Manufacturing Engineering student and I just finished a robotics class this past semester, we got to use, program, and design the brand new robots and robotic cells. Its incredible!
Mathew from Saylorsburg, PA
Similar Colleges
 Philadelphia, PA
 East Stroudsburg, PA
 Indiana, PA
 Kutztown, PA
 University Park, PA
 Philadelphia, PA
 York, PA
 Providence, RI
Pennsylvania College of Technology