Overview

University of Richmond
University Of Richmond, VA, USA
Private
4 Year
Overview
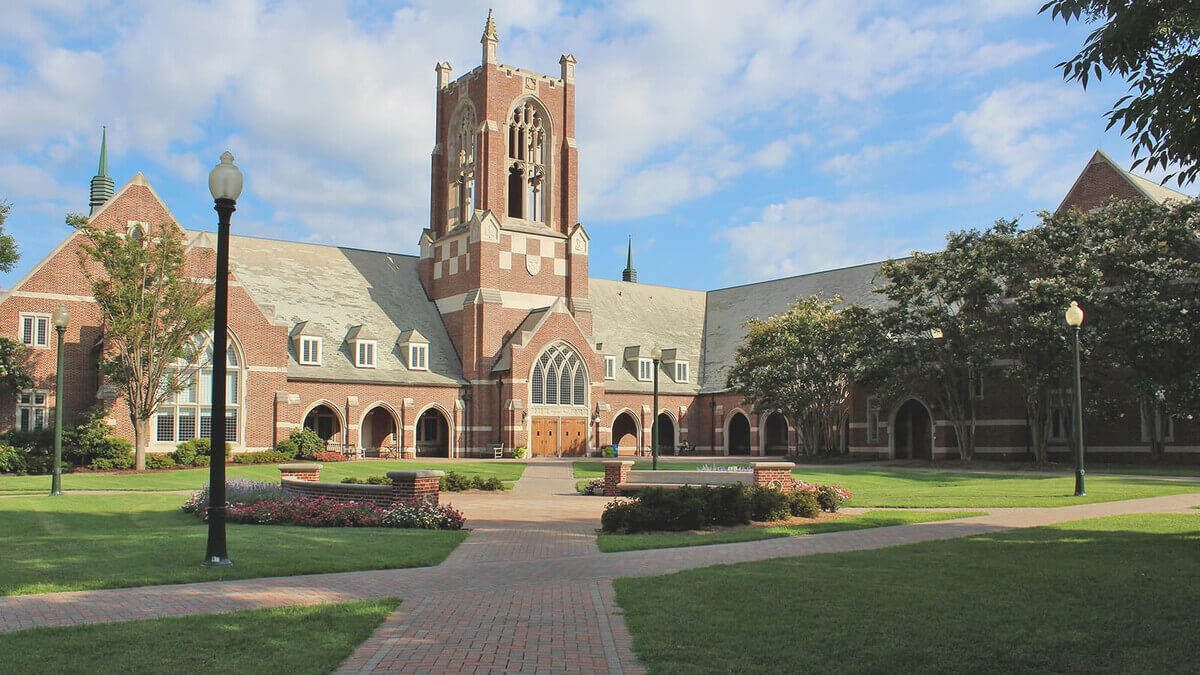
The University of Richmond is a 4-year liberal arts university located in Virginia’s capital city. Richmond confers bachelor’s degrees in over 60 academic majors and its Jepson School of Leadership is the first school to offer a Leadership and Management Studies program. Additionally, Richmond’s Living-Learning Programs provide opportunities for students with common academic interests to live together as a small community. For athletically-inclined students, Richmond fields 15 men’s and women’s teams and is the only university known as the Spiders.
Acceptance Rate:
24%
Average Net Price:
$25,700
Campus Setting:
Small city
Average GPA
3.8
Average ACT Composite
32
Average SAT Composite
1395
Virtual Tour
Tuition, Cost & Aid
Affordability & Cost
Average Net Price
$25,700
Discover how military service can help you pay for college
Explore Military PathwaysTuition
| In-State Tuition In-state tuition is the tuition charged by institutions to those students who meet the state's or institution's residency requirements. In-district tuition is the tuition charged by the institution to those students residing in the locality in which they attend school and may be a lower rate than in-state tuition if offered by the institution. | $62,600 |
| Out-of-State Tuition Out-of-state tuition is the tuition charged by institutions to those students who do not meet the state’s or institution’s residency requirements. Out-of-district tuition is the tuition charged by the institution to those students not residing in the locality in which they attend school. | $62,600 |
Additional Costs
Room and Board The weighted average for room and board and other expenses is generated as follows:
| $16,210 |
| Books and Supplies | $1000 |
Average Net Price By Family Income
Income
Average Amount
< $30k
$11,126
$30k - $48k
$9,843
$48k - $75k
$14,921
$75k - $110k
$23,302
$110k+
$41,330
Financial Aid: visit page
Financial Aid Email: [email protected]
Aid & Grants
0
100
99%
Need Met
Students Receiving Gift Aid Percent of undergraduate students awarded federal gift aid. Federal gift aid includes any grant or scholarship aid awarded, from the federal government, a state or local government, the institution, and other sources known by the institution. Students Receiving Grants Percent of undergraduate students awarded grant aid. Grant aid includes any grant or scholarship aid awarded, from the federal government, a state or local government, the institution, and other sources known by the institution.
18%
Average Aid Per Year
$46,385
18%
Average Federal Grant Aid Per Year
$3,830
Average Institution Grant Aid Per Year
$46,078
Students receiving state aid Students receiving federal aid
15%
Average State Grant Aid Per Year
$4315
41%
Average Federal Grant Aid Per Year
$3,830
Average Grant & Scholarship By Family Income
Income
Average Amount
< $30k
$63,643
$30k - $48k
$66,155
$48k - $75k
$57,242
$75k - $110k
$46,898
$110k+
$25,943
Total Needs Based Scholarships/Grants Total amount of grant or scholarship aid awarded to all undergraduates from the federal government, state/local government, the institution, and other sources known to the institution.
$60,384,916
Total Non-Need-Based Scholarships/Grants
$25,299,548
Student Loans
Students Borrowing Loans Loans to students - Any monies that must be repaid to the lending institution for which the student is the designated borrower. Includes all Title IV subsidized and unsubsidized loans and all institutionally- and privately-sponsored loans. Does not include PLUS and other loans made directly to parents.
32%
Average Loan Amount Per Year
$8,250
Average Debt at Graduation The median federal debt of undergraduate borrowers who graduated. This figure includes only federal loans; it excludes private student loans and Parent PLUS loans.
$19,000
Median Monthly Loan Payment The median monthly loan payment for student borrowers who completed, if it were repaid over 10 years at a 5.05% interest rate.
$191
Students receiving federal loans
31%
Average Federal Loans Per Year
$4,950
Average Other Loans Per Year
$24,529
Admissions
Key Admissions Stats
Institution Type
Private
- Not for Profit
- Coed
Need Aware
This school may consider an applicant’s financial situation when deciding admission
Level of Institution
4 Year
Campus Setting
Small city
14364
Students Applied
35%
Transfer Acceptance Rate
48
Transfer Students Admitted
Admissions Requirements
SAT
No
ACT
No
Transcript
Yes
Test Optional
Yes
SAT Subject Tests
Yes
AP Course Credit
Yes
Dual Enrollment
Yes
Important Deadlines
| Application Type | Application Deadline | Reply Deadline |
|---|---|---|
| Early Decision Acceptance is binding so student must attend college if accepted. | November 1 | |
| Early Action Acceptance is not binding, but student will receive admissions decision earlier. | November 1 | |
| Fall Regular Decision | January 1 | |
| Spring Regular Decision | November 1 | |
| Other | January 15 |
Application Fee
$50
Fee waivers availableApplications Accepted
Admitted Student Stats
In-State Students
15%
Out-Of-State Students
79%
18%
Submitting ACT
22%
Submitting SAT
Average ACT Composite: 32
0
36
Average SAT Composite: 1395
0
1600
SAT Percentiles
Math
25th
710
75th
780
Reading
25th
688
75th
750
3.8
Average GPA
Students Enrolled By GPA
3.75+
45%
3.50 - 3.74
31%
3.25 - 3.49
16%
3.00 - 3.24
5%
2.50 - 2.99
2%
2.00 - 2.49
1%
Students Enrolled By Class Rank
Top 10%
56
Top 25%
83
Top 50%
98
Admissions Resources
For International Student Services: visit page
For Students with Disabilities: visit page
For Veteran Services: visit page
Academics
Key Academic Stats
Highest Degree Offered
Doctorate
Total Number of Students
3,876
Total Number of Undergrads
3,145
0
100
82%
Graduate in 4 Years US National: 28%
0
100
88%
Graduate in 6 Years US National: 52%
Student:Faculty Ratio
8:1
US National: 21:1Non Traditional Learning
- Online Classes
- Online Undergrad Degrees
- Summer Sessions
- Combined Institution Double Degree Programs
- Some Programs Requires Co-Op/Internship
Learning Options
- ROTC Army
- Study Abroad
- Honors Program
- Teacher Certification Offered
Classroom Sizes
2-19 Students
72%
20-39 Students
27%
Degrees and Majors
MAJORS
67
Majors
| A B M D | |
|---|---|
| AREA, ETHNIC, CULTURAL, GENDER, AND GROUP STUDIES | |
| BIOLOGICAL AND BIOMEDICAL SCIENCES | |
| BUSINESS, MANAGEMENT, MARKETING, AND RELATED SUPPORT SERVICES | |
| COMMUNICATION, JOURNALISM, AND RELATED PROGRAMS | |
| COMPUTER AND INFORMATION SCIENCES AND SUPPORT SERVICES | |
| EDUCATION | |
| ENGLISH LANGUAGE AND LITERATURE/LETTERS | |
| FOREIGN LANGUAGES, LITERATURES, AND LINGUISTICS | |
| HEALTH PROFESSIONS AND RELATED PROGRAMS | |
| HISTORY | |
| HOMELAND SECURITY, LAW ENFORCEMENT, FIREFIGHTING AND RELATED PROTECTIVE SERVICES | |
| LEGAL PROFESSIONS AND STUDIES | |
| LIBERAL ARTS AND SCIENCES, GENERAL STUDIES AND HUMANITIES | |
| MATHEMATICS AND STATISTICS | |
| MULTI/INTERDISCIPLINARY STUDIES | |
| NATURAL RESOURCES AND CONSERVATION | |
| PHILOSOPHY AND RELIGIOUS STUDIES | |
| PHYSICAL SCIENCES | |
| PSYCHOLOGY | |
| PUBLIC ADMINISTRATION AND SOCIAL SERVICE PROFESSIONS | |
| SOCIAL SCIENCES | |
| VISUAL AND PERFORMING ARTS |
Faculty Overview
0
100
64%
Faculty With Terminal Degree US National: 36%
Gender
Male
Female
US National: 42%
US National: 48%
Ethnicity
African American
Asian/Pacific Islander
White
Hispanic
Unknown
Campus Life
Key Campus Stats
Student Gender
Male
Female
46%
US National: 44%54%
US National: 56%Residency
In-State Students
15%
Out-Of-State Students
79%
Size of Town
Small city
US States Represented
51
Countries Represented
73
Ethnicity
African American
6%
Asian/Pacific Islander
6%
Hispanic
10%
White
59%
Multiracial
4%
Unknown
2%
Percent of First Generation Students
12%
Student Organizations
170
LGBTQIA Student Resource Groups
Yes
On Campus Women's Center
No
Cultural Student Resource Groups
Yes
Housing
0
100
91%
Undergrads Living on Campus
On-campus living required of freshman
No
Disability Housing Available
Yes
0
100
83%
Freshman Living on Campus
Athletics
Divisional Sports Nickname
Spiders
School Colors
red and blue
Varsity Athletics Association
NCAA
Varsity Athletics Conference Primary
Colonial Athletic Association
Total Male Athletes
223
Total Female Athletes
176
Intramural Sports
2
Sports Club
20
Sports Team (Men)
- Baseball
- Basketball
- Cross Country
- Football
- Golf
- Lacrosse
- Tennis
Sports Team (Women)
- Basketball
- Cross Country
- Field Hockey
- Golf
- Lacrosse
- Soccer
- Swimming
- Tennis
- Track and Field
University of Richmond Athletics: visit page
Campus Safety
24-HR security patrol
Yes
Campus emergency phones
Yes
24-HR escort safety rides
Yes
Mobile campus emergency alert
Yes
After Graduation
Post Grad Stats
Average Salary
6 years after graduation
$78,900
Top 5 Cities
Richmond
New York
Washington
Philadelphia
Boston
Top 5 Employers
University of Richmond
Capital One
Deloitte
PwC
Virginia Commonwealth University
Top 5 Sectors
Business Development
Education
Sales
Finance
Operations
Average Debt at Graduation The median federal debt of undergraduate borrowers who graduated. This figure includes only federal loans; it excludes private student loans and Parent PLUS loans.
$19,000
Loan Default Rate
1%
National: 8%
Median Monthly Loan Payment The median monthly loan payment for student borrowers who completed, if it were repaid over 10 years at a 5.05% interest rate.
$191
REVIEWS
Read What Students Are SayingI was challenged more than ever in HS just in my first semester at UR.
Valerie from Westerville, OH
The classes are what you make of it. The opportunity to learn is available if you put the effort in and take advantage of all the professors have to offer. Also, there are constantly guest speakers, such as Thomas Friedman, who come to campus. Do not miss out on these lectures, you will learn so much!
Alexis from Wexford, PA
Because Richmond is a liberal arts and sciences school, there are many opportunities and educational paths to choose from. Richmond is one of the top business schools in the nation and one of the only schools with a leadership program. There is definitely enough classes to fulfill any career goal!
Lauren from Midlothian, VA
While college is certainly a step up from high school, the professors at University of Richmond try their best to make the transition smooth. As a result, students learn a lot and have a great college experience.
Clarke from Overland Park, KS
The University of Richmond has a large suburban campus right in the middle of the active and corky city of Richmond. The classes are small, engaging, and fun! The social atmosphere, while not for everyone, is low key and student organizations are attempting to diversify it.
Kylie from Perkasie, PA
There are so many classes to choose from!! I love the small class size and individual attention. It seems professors really care about their students!
Taylor from Midlothian, VA
Great small school for students who want all their professors to know them by name; all my classes were about 20 kids!
Professors care about teaching, not about passing you.
Most students are hired right out of school or go to get additional degrees, they help a lot with getting summer internships.
Professors care about teaching, not about passing you.
Most students are hired right out of school or go to get additional degrees, they help a lot with getting summer internships.
Betty
U of R is a school with a lot of opportunities. The classes are demanding and the people can be really hard to adjust to if you didn't grow up in a northeastern upperclass town, but if you're willing to put in the effort it can really pay off here.
Megan from Butler, PA
Most beautiful. School. Ever.
Lauren from Easton, PA
I have attended the University of Richmond for several years and had several outstanding experiences. The professors exude excellence, passion and commitment to their students. You are inspired through their knowledge, creativity and valuable insight. All aspects of the University are supportive.
SPCS Student
Similar Colleges
 Williamsburg, VA
 Harrisonburg, VA
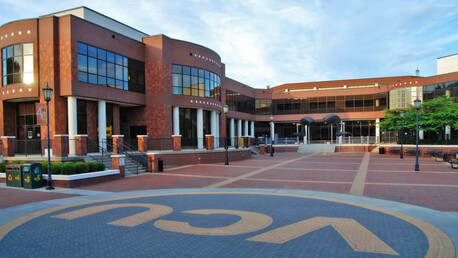 Richmond, VA
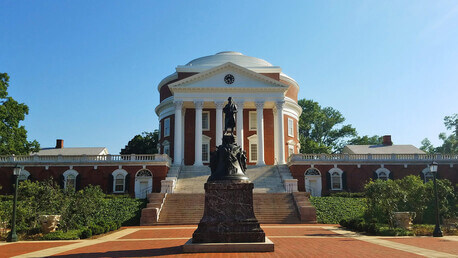 Charlottesville, VA
 Washington, DC
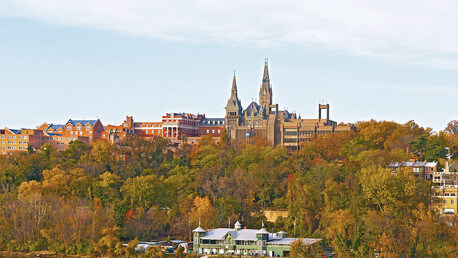 Washington, DC
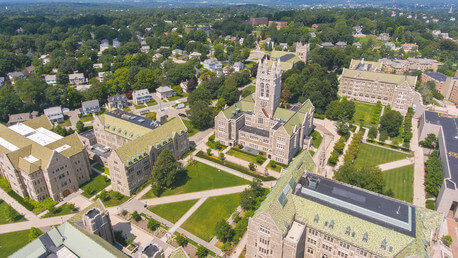 Chestnut Hill, MA
 Boston, MA
 New York, NY
 Durham, NC
 Chapel Hill, NC
 Winston Salem, NC
University of Richmond