Overview



Limestone University
Gaffney, SC, USA
Private
4 Year
Overview
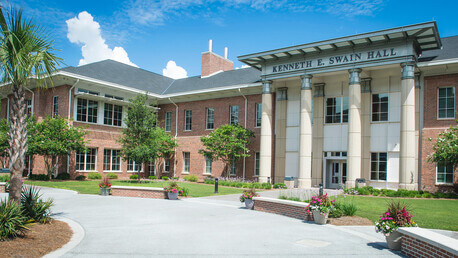
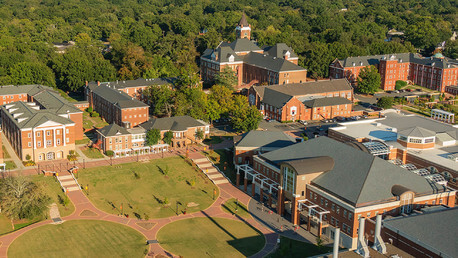
Limestone College is an independent liberal arts school located in Gaffney, South Carolina. The school has “selective” admissions and provides a curriculum based on Christian values and ethics. Traditional students attend the “Day” program, while there are also evening and online courses for convenience. Limestone also offers a 4+1 program to complete an MBA in five years.
Acceptance Rate:
89%
Average Net Price:
$22,707
Campus Setting:
Suburb or town
Average GPA
3.5
Average ACT Composite
20
Average SAT Composite
1073
Tuition, Cost & Aid
Affordability & Cost
Average Net Price
$22,707
Discover how military service can help you pay for college
Explore Military PathwaysTuition
| In-State Tuition In-state tuition is the tuition charged by institutions to those students who meet the state's or institution's residency requirements. In-district tuition is the tuition charged by the institution to those students residing in the locality in which they attend school and may be a lower rate than in-state tuition if offered by the institution. | $27,500 |
| Out-of-State Tuition Out-of-state tuition is the tuition charged by institutions to those students who do not meet the state’s or institution’s residency requirements. Out-of-district tuition is the tuition charged by the institution to those students not residing in the locality in which they attend school. | $27,500 |
Additional Costs
Room and Board The weighted average for room and board and other expenses is generated as follows:
| $10,079 |
| Books and Supplies | $1240 |
Average Net Price By Family Income
Income
Average Amount
< $30k
$21,574
$30k - $48k
$23,334
$48k - $75k
$26,860
$75k - $110k
$25,291
$110k+
$27,264
Financial Aid: visit page
Financial Aid Email: [email protected]
Aid & Grants
0
100
60%
Need Met
Students Receiving Gift Aid Percent of undergraduate students awarded federal gift aid. Federal gift aid includes any grant or scholarship aid awarded, from the federal government, a state or local government, the institution, and other sources known by the institution. Students Receiving Grants Percent of undergraduate students awarded grant aid. Grant aid includes any grant or scholarship aid awarded, from the federal government, a state or local government, the institution, and other sources known by the institution.
42%
Average Aid Per Year
$19,016
42%
Average Federal Grant Aid Per Year
$5,837
Average Institution Grant Aid Per Year
$13,189
Students receiving state aid Students receiving federal aid
50%
Average State Grant Aid Per Year
$6581
49%
Average Federal Grant Aid Per Year
$5,837
Average Grant & Scholarship By Family Income
Income
Average Amount
< $30k
$23,252
$30k - $48k
$21,467
$48k - $75k
$17,045
$75k - $110k
$14,762
$110k+
$14,644
Total Needs Based Scholarships/Grants Total amount of grant or scholarship aid awarded to all undergraduates from the federal government, state/local government, the institution, and other sources known to the institution.
$12,274,863
Total Non-Need-Based Scholarships/Grants
$2,600,724
Student Loans
Students Borrowing Loans Loans to students - Any monies that must be repaid to the lending institution for which the student is the designated borrower. Includes all Title IV subsidized and unsubsidized loans and all institutionally- and privately-sponsored loans. Does not include PLUS and other loans made directly to parents.
70%
Average Loan Amount Per Year
$7,220
Average Debt at Graduation The median federal debt of undergraduate borrowers who graduated. This figure includes only federal loans; it excludes private student loans and Parent PLUS loans.
$17,500
Median Monthly Loan Payment The median monthly loan payment for student borrowers who completed, if it were repaid over 10 years at a 5.05% interest rate.
$265
Students receiving federal loans
69%
Average Federal Loans Per Year
$5,612
Average Other Loans Per Year
$15,891
Admissions
Key Admissions Stats
Institution Type
Private
- Not for Profit
- Coed
Need Blind
This school does not consider an applicant’s financial situation when deciding admission
Level of Institution
4 Year
Campus Setting
Suburb or town
2260
Students Applied
52%
Transfer Acceptance Rate
171
Transfer Students Admitted
Admissions Requirements
SAT
No
ACT
No
Transcript
Yes
Test Optional
Yes
SAT Subject Tests
No
AP Course Credit
Yes
Dual Enrollment
Yes
Important Deadlines
Rolling Admissions
The college has rolling admissions, which means applications are accepted any time throughout the year.
Applications Accepted
Admitted Student Stats
In-State Students
61%
Out-Of-State Students
25%
27%
Submitting ACT
45%
Submitting SAT
Average ACT Composite: 20
0
36
Average SAT Composite: 1073
0
1600
SAT Percentiles
Math
25th
490
75th
580
Reading
25th
490
75th
580
3.5
Average GPA
Students Enrolled By GPA
3.75+
22%
3.50 - 3.74
14%
3.25 - 3.49
15%
3.00 - 3.24
19%
2.50 - 2.99
16%
2.00 - 2.49
12%
Students Enrolled By Class Rank
Top 10%
4
Top 25%
16
Top 50%
47
Admissions Resources
For Students with Disabilities: visit page
For Veteran Services: visit page
Academics
Key Academic Stats
Highest Degree Offered
Master's
Total Number of Students
1,786
Total Number of Undergrads
1,602
0
100
21%
Graduate in 4 Years US National: 28%
0
100
30%
Graduate in 6 Years US National: 52%
Student:Faculty Ratio
11:1
US National: 21:1Non Traditional Learning
- Online Classes
- Online Undergrad Degrees
- Summer Sessions
- Combined Institution Double Degree Programs
- Some Programs Requires Co-Op/Internship
Learning Options
- Honors Program
- Teacher Certification Offered
Classroom Sizes
2-19 Students
68%
20-39 Students
31%
Degrees and Majors
MAJORS
43
Majors
| A B M D | |
|---|---|
| AGRICULTURAL/ANIMAL/PLANT/VETERINARY SCIENCE AND RELATED FIELDS | |
| BIOLOGICAL AND BIOMEDICAL SCIENCES | |
| BUSINESS, MANAGEMENT, MARKETING, AND RELATED SUPPORT SERVICES | |
| COMMUNICATION, JOURNALISM, AND RELATED PROGRAMS | |
| COMPUTER AND INFORMATION SCIENCES AND SUPPORT SERVICES | |
| EDUCATION | |
| ENGLISH LANGUAGE AND LITERATURE/LETTERS | |
| FAMILY AND CONSUMER SCIENCES/HUMAN SCIENCES | |
| HEALTH PROFESSIONS AND RELATED PROGRAMS | |
| HISTORY | |
| HOMELAND SECURITY, LAW ENFORCEMENT, FIREFIGHTING AND RELATED PROTECTIVE SERVICES | |
| LEGAL PROFESSIONS AND STUDIES | |
| LIBERAL ARTS AND SCIENCES, GENERAL STUDIES AND HUMANITIES | |
| MATHEMATICS AND STATISTICS | |
| PARKS, RECREATION, LEISURE, FITNESS, AND KINESIOLOGY | |
| PHYSICAL SCIENCES | |
| PSYCHOLOGY | |
| PUBLIC ADMINISTRATION AND SOCIAL SERVICE PROFESSIONS | ✓ ✓ |
| VISUAL AND PERFORMING ARTS |
Faculty Overview
0
100
80%
Faculty With Terminal Degree US National: 36%
Gender
Male
Female
US National: 42%
US National: 48%
Ethnicity
African American
Asian/Pacific Islander
White
Hispanic
Unknown
Campus Life
Key Campus Stats
Student Gender
Male
Female
49%
US National: 44%51%
US National: 56%Residency
In-State Students
61%
Out-Of-State Students
25%
Size of Town
Suburb or town
US States Represented
28
Countries Represented
37
Ethnicity
African American
31%
Asian/Pacific Islander
1%
Hispanic
3%
Native American
1%
White
47%
Multiracial
2%
Unknown
15%
Percent of First Generation Students
43%
Student Organizations
35
LGBTQIA Student Resource Groups
No
On Campus Women's Center
No
Cultural Student Resource Groups
No
Housing
0
100
62%
Undergrads Living on Campus
On-campus living required of freshman
Yes
Disability Housing Available
No
0
100
39%
Freshman Living on Campus
Athletics
Divisional Sports Nickname
St. Bernard
School Colors
royal blue, gold, and white
Varsity Athletics Association
NCAA
Varsity Athletics Conference Primary
South Atlantic Conference
Total Male Athletes
503
Total Female Athletes
233
Intramural Sports
16
Sports Club
2
Sports Team (Men)
- Baseball
- Basketball
- Cross Country
- Football
- Golf
- Lacrosse
- Soccer
- Tennis
- Track and Field
- Volleyball
- Wrestling
Sports Team (Women)
- Basketball
- Cheerleading-Dance Team
- Cross Country
- Field Hockey
- Golf
- Lacrosse
- Soccer
- Softball
- Tennis
- Track and Field
- Volleyball
- Wrestling
- Acrobatics
- Tumbling
Limestone University Athletics: visit page
Campus Safety
24-HR security patrol
Yes
Campus emergency phones
Yes
24-HR escort safety rides
Yes
Mobile campus emergency alert
Yes
After Graduation
Post Grad Stats
Average Salary
6 years after graduation
$41,600
Top 5 Cities
Greenville
Columbia
Charleston
Charlotte
Florence
Top 5 Employers
Limestone College
US Army
BlueCross BlueShield of South Carolina
Duke Energy Corporation
Michelin
Top 5 Sectors
Operations
Business Development
Sales
Information Technology
Community and Social Services
Average Debt at Graduation The median federal debt of undergraduate borrowers who graduated. This figure includes only federal loans; it excludes private student loans and Parent PLUS loans.
$17,500
Loan Default Rate
9%
National: 8%
Median Monthly Loan Payment The median monthly loan payment for student borrowers who completed, if it were repaid over 10 years at a 5.05% interest rate.
$265
REVIEWS
Read What Students Are SayingProfessors are extremely helpful, and are available to help whenever you need them!
Katherine from Trenton, NC
The professors here are great. They know what they are talking about in lecture, and they offer plenty of flexible office hours when you don't understand something. Some professors even stay on campus late in the evening to offer office hours. The classes are relatively small compared to large universities, so you get more interactions with the professor other than just listening to someone talk the whole class.
Brittany from Gaffney, SC
Limestone College is a very personal college. It gives you the opportunity to get to know others, as well as your professors easily. All the while offering a christian atmosphere.
Kori from Boiling Springs, SC
Limestone is a very good school to go to. The teachers take pride in helping students. By far its a good college.
Adrian from Camden, SC
Similar Colleges
 Anderson, SC
 Charleston, SC
 Charleston, SC
 Hartsville, SC
 Greenville, SC
 Greenwood, SC
 Newberry, SC
- Tigerville, SC
 Columbia, SC
 Conway, SC
 Spartanburg, SC
 Rock Hill, SC
See All
Limestone University