Overview

Bristol Community College
Fall River, MA, USA
Public
2 Year
Overview
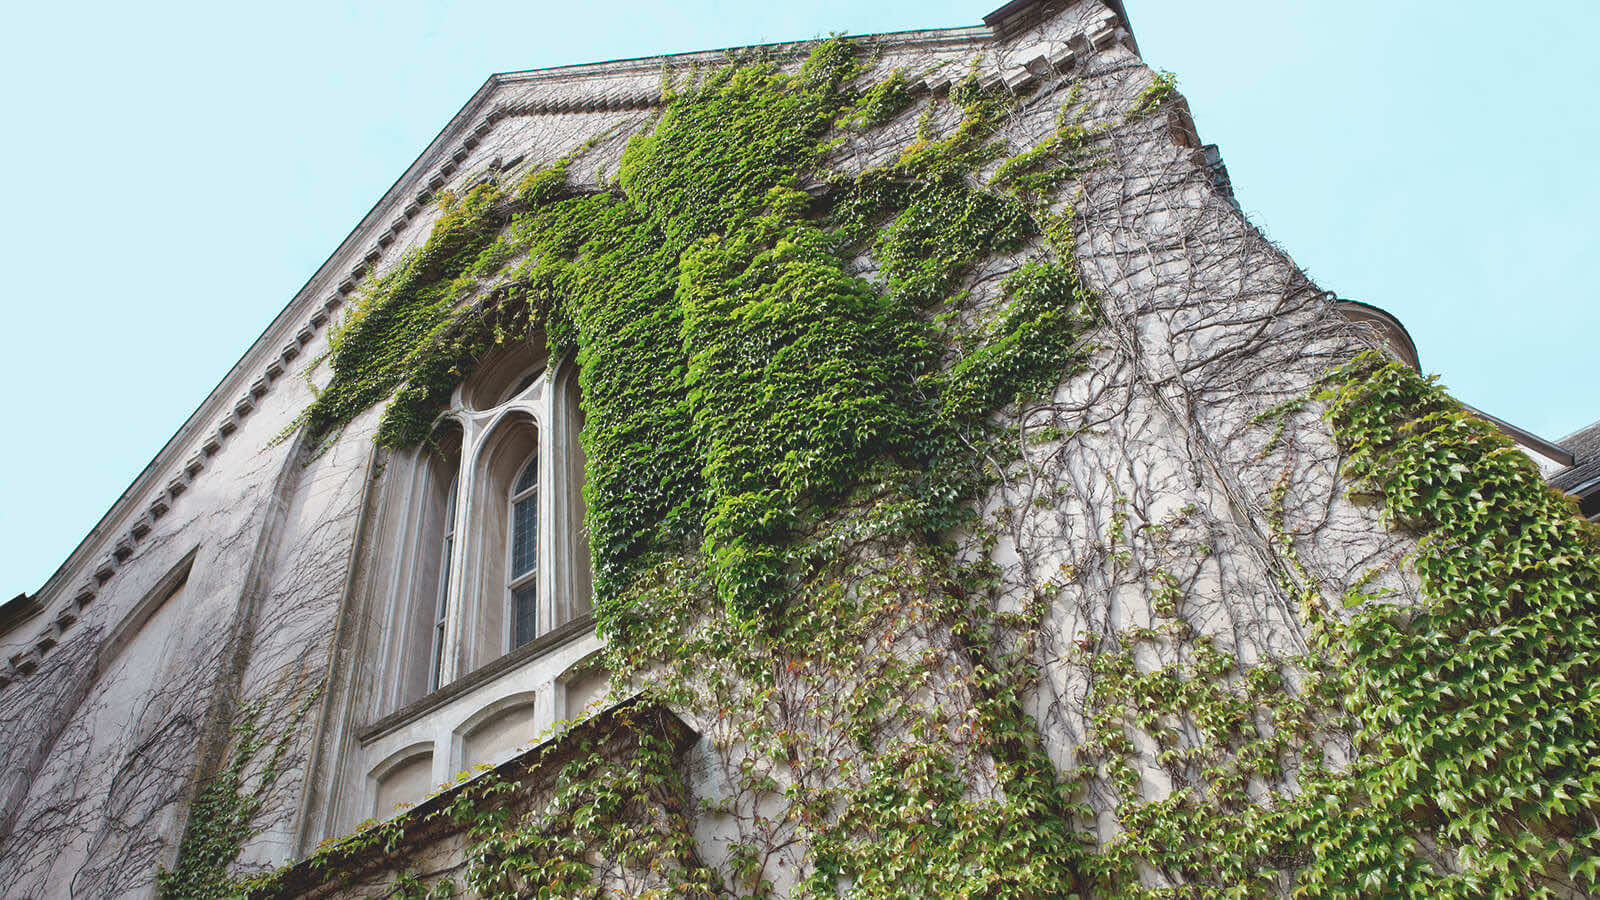
Just minutes from the Massachusetts/Rhode Island border, Bristol Community College is situated between the Taunton River and Watuppa Pond in the town of Fall River. For female students, the Women’s Center at BCC offers empowerment through participation in intersectionality workshops and seminars. BCC also features several museums to enhance the learning experience, from the Grimshaw-Gudewicz Art Gallery to the Holocaust Center. In addition to their coursework, BCC students get involved in the community by participating in the Bristol Mobile Food Market which takes place once a month during the school year.
Average Net Price:
$7,194
Campus Setting:
Suburb or town
Tuition, Cost & Aid
Affordability & Cost
Average Net Price
$7,194
Discover how military service can help you pay for college
Explore Military PathwaysTuition
| In-State Tuition In-state tuition is the tuition charged by institutions to those students who meet the state's or institution's residency requirements. In-district tuition is the tuition charged by the institution to those students residing in the locality in which they attend school and may be a lower rate than in-state tuition if offered by the institution. | $5,412 |
| Out-of-State Tuition Out-of-state tuition is the tuition charged by institutions to those students who do not meet the state’s or institution’s residency requirements. Out-of-district tuition is the tuition charged by the institution to those students not residing in the locality in which they attend school. | $10,356 |
Additional Costs
| Books and Supplies | $2000 |
Average Net Price By Family Income
Income
Average Amount
< $30k
$4,866
$30k - $48k
$5,980
$48k - $75k
$6,569
$75k - $110k
$10,000
$110k+
$11,649
Financial Aid: visit page
Aid & Grants
Students Receiving Gift Aid Percent of undergraduate students awarded federal gift aid. Federal gift aid includes any grant or scholarship aid awarded, from the federal government, a state or local government, the institution, and other sources known by the institution. Students Receiving Grants Percent of undergraduate students awarded grant aid. Grant aid includes any grant or scholarship aid awarded, from the federal government, a state or local government, the institution, and other sources known by the institution.
47%
Average Aid Per Year
$5,620
47%
Average Federal Grant Aid Per Year
$5,109
Average Institution Grant Aid Per Year
$1,743
Students receiving state aid Students receiving federal aid
56%
Average State Grant Aid Per Year
$1585
54%
Average Federal Grant Aid Per Year
$5,109
Total Needs Based Scholarships/Grants Total amount of grant or scholarship aid awarded to all undergraduates from the federal government, state/local government, the institution, and other sources known to the institution.
$18,302,656
Total Non-Need-Based Scholarships/Grants
$165,734
Student Loans
Students Borrowing Loans Loans to students - Any monies that must be repaid to the lending institution for which the student is the designated borrower. Includes all Title IV subsidized and unsubsidized loans and all institutionally- and privately-sponsored loans. Does not include PLUS and other loans made directly to parents.
37%
Average Loan Amount Per Year
$4,965
Average Debt at Graduation The median federal debt of undergraduate borrowers who graduated. This figure includes only federal loans; it excludes private student loans and Parent PLUS loans.
$3,853
Median Monthly Loan Payment The median monthly loan payment for student borrowers who completed, if it were repaid over 10 years at a 5.05% interest rate.
$67
Students receiving federal loans
37%
Average Federal Loans Per Year
$4,973
Average Other Loans Per Year
$3,000
Admissions
Key Admissions Stats
Institution Type
Public
- Not for Profit
- Coed
Need Aware
This school may consider an applicant’s financial situation when deciding admission
Level of Institution
2 Year
Campus Setting
Suburb or town
Admissions Requirements
Transcript
No
Test Optional
No
SAT Subject Tests
No
AP Course Credit
Yes
Dual Enrollment
Yes
Important Deadlines
| Application Type | Application Deadline | Reply Deadline |
|---|---|---|
| Fall Regular Decision | September 7 |
Application Fee
$10
Applications Accepted
Admitted Student Stats
In-State Students
92%
Out-Of-State Students
13%
Students Enrolled By Household Income
< $30k
237
$30k - $48k
94
$48k - $75k
76
$75k - $110k
54
$110k+
66
Admissions Resources
Admissions: visit page
For Students with Disabilities: visit page
For Veteran Services: visit page
Academics
Key Academic Stats
Highest Degree Offered
Associate's
Total Number of Students
5,822
Total Number of Undergrads
5,822
Student:Faculty Ratio
14:1
US National: 21:1Non Traditional Learning
- Online Classes
- Online Undergrad Degrees
- Summer Sessions
- Some Programs Requires Co-Op/Internship
Learning Options
- Honors Program
Degrees and Majors
MAJORS
26
Majors
| A B M D | |
|---|---|
| AGRICULTURAL/ANIMAL/PLANT/VETERINARY SCIENCE AND RELATED FIELDS | |
| BIOLOGICAL AND BIOMEDICAL SCIENCES | |
| BUSINESS, MANAGEMENT, MARKETING, AND RELATED SUPPORT SERVICES | |
| COMMUNICATION, JOURNALISM, AND RELATED PROGRAMS | |
| COMPUTER AND INFORMATION SCIENCES AND SUPPORT SERVICES | |
| CULINARY, ENTERTAINMENT, AND PERSONAL SERVICES | |
| EDUCATION | |
| ENGINEERING | |
| ENGINEERING/ENGINEERING-RELATED TECHNOLOGIES/TECHNICIANS | |
| FOREIGN LANGUAGES, LITERATURES, AND LINGUISTICS | |
| HEALTH PROFESSIONS AND RELATED PROGRAMS | |
| HOMELAND SECURITY, LAW ENFORCEMENT, FIREFIGHTING AND RELATED PROTECTIVE SERVICES | |
| LEGAL PROFESSIONS AND STUDIES | |
| LIBERAL ARTS AND SCIENCES, GENERAL STUDIES AND HUMANITIES | |
| PUBLIC ADMINISTRATION AND SOCIAL SERVICE PROFESSIONS | |
| VISUAL AND PERFORMING ARTS |
Faculty Overview
Gender
Male
Female
US National: 42%
US National: 48%
Ethnicity
African American
Asian/Pacific Islander
White
Hispanic
Campus Life
Key Campus Stats
Student Gender
Male
Female
34%
US National: 44%66%
US National: 56%Residency
In-State Students
92%
Out-Of-State Students
13%
Size of Town
Suburb or town
US States Represented
7
Countries Represented
7
Ethnicity
African American
11%
Asian/Pacific Islander
2%
Hispanic
13%
White
58%
Multiracial
5%
Unknown
10%
Percent of First Generation Students
51%
Student Organizations
16
LGBTQIA Student Resource Groups
No
On Campus Women's Center
Yes
Cultural Student Resource Groups
No
Housing
On-campus living required of freshman
No
Disability Housing Available
No
Athletics
Varsity Athletics Association
NJCAA
Varsity Athletics Conference Primary
Not applicable
Intramural Sports
5
Campus Safety
24-HR security patrol
Yes
Campus emergency phones
Yes
24-HR escort safety rides
Yes
Mobile campus emergency alert
No
After Graduation
Post Grad Stats
Average Salary
6 years after graduation
$35,100
Average Debt at Graduation The median federal debt of undergraduate borrowers who graduated. This figure includes only federal loans; it excludes private student loans and Parent PLUS loans.
$3,853
Loan Default Rate
14%
National: 8%
Median Monthly Loan Payment The median monthly loan payment for student borrowers who completed, if it were repaid over 10 years at a 5.05% interest rate.
$67
REVIEWS
Read What Students Are SayingI've been to the campus it's clean and soothing; it's well looked after and taken care of. They have a map and clearly marked buildings for new students.
Jessica from Brockton, MA
BCC Has provided me with the best foundation for me to start my path as a artist, that I think I could eve hope for. Teachers, both in the Art department, as well as any other department are friendly and provide a comfortable working environment. Also, not only have I learned a lot from the faculty, but BCC fosters a greet community enviroment, in which I've learned so many things from my fellow students.
Annie from East Freetown, MA
Similar Colleges
 Providence, RI
 Providence, RI
- Warwick, RI
 Kingston, RI
 Bridgewater, MA
 Boston, MA
- West Barnstable, MA
 Amherst, MA
 Boston, MA
- Brockton, MA
 Salem, MA
 North Dartmouth, MA
See All
Bristol Community College