Overview
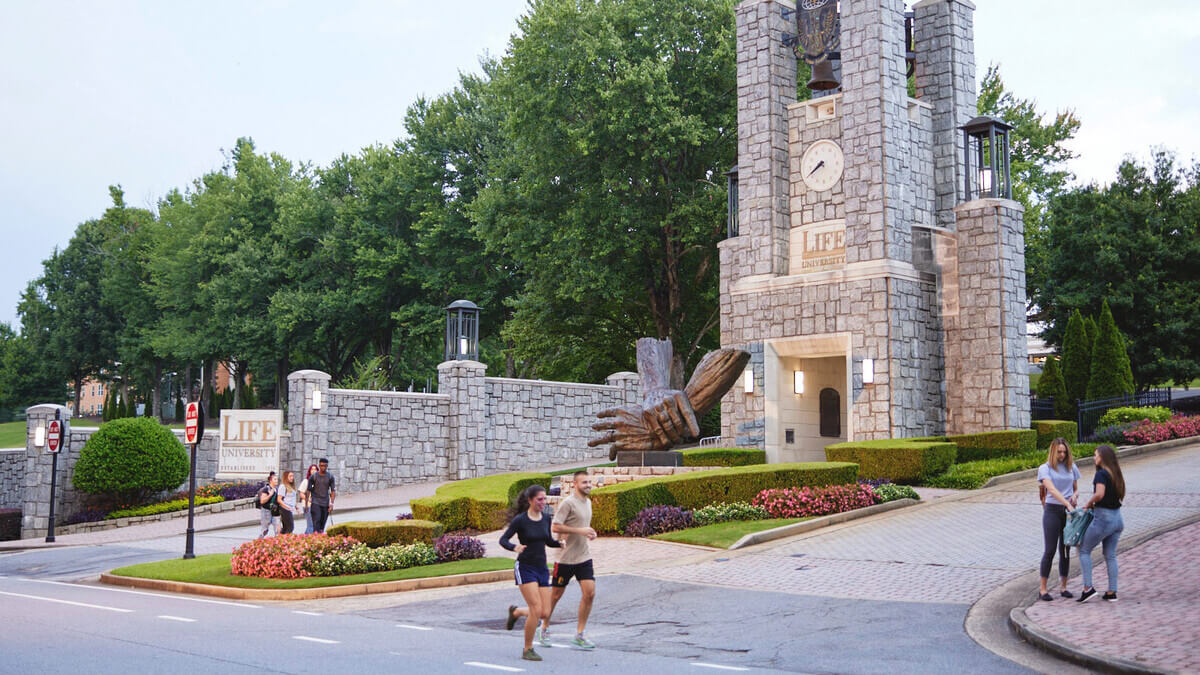


Life University
Marietta, GA, USA
Private
4 Year
Overview
Life University is the biggest single-campus chiropractic college in the world. It is a private institution founded by a doctor of chiropractic that offers health and wellness-focused programs. Life University’s education is founded around Vitalism, or the belief that “all organic systems in the universe are conscious, self-developing, self-maintaining, and self-healing; that these systems work best when they are free of interference.” Life University also maintains the Center for Excellence in Teaching & Learning, as well as the Applied Clinical Neuroscience Institute.
Acceptance Rate:
98%
Average Net Price:
$30,857
Campus Setting:
Small city
Average GPA
3.2
Average ACT Composite
20
Average SAT Composite
1029
Tuition, Cost & Aid
Affordability & Cost
Average Net Price
$30,857
Discover how military service can help you pay for college
Explore Military PathwaysTuition
| In-State Tuition In-state tuition is the tuition charged by institutions to those students who meet the state's or institution's residency requirements. In-district tuition is the tuition charged by the institution to those students residing in the locality in which they attend school and may be a lower rate than in-state tuition if offered by the institution. | $15,036 |
| Out-of-State Tuition Out-of-state tuition is the tuition charged by institutions to those students who do not meet the state’s or institution’s residency requirements. Out-of-district tuition is the tuition charged by the institution to those students not residing in the locality in which they attend school. | $15,036 |
Additional Costs
Room and Board The weighted average for room and board and other expenses is generated as follows:
| $13,959 |
| Books and Supplies | $2400 |
Average Net Price By Family Income
Income
Average Amount
< $30k
$26,398
$30k - $48k
$24,983
$48k - $75k
$26,845
$75k - $110k
$29,005
$110k+
$31,874
Financial Aid: visit page
Financial Aid Email: [email protected]
Aid & Grants
0
100
39%
Need Met
Students Receiving Gift Aid Percent of undergraduate students awarded federal gift aid. Federal gift aid includes any grant or scholarship aid awarded, from the federal government, a state or local government, the institution, and other sources known by the institution. Students Receiving Grants Percent of undergraduate students awarded grant aid. Grant aid includes any grant or scholarship aid awarded, from the federal government, a state or local government, the institution, and other sources known by the institution.
40%
Average Aid Per Year
$11,923
40%
Average Federal Grant Aid Per Year
$5,561
Average Institution Grant Aid Per Year
$9,735
Students receiving state aid Students receiving federal aid
26%
Average State Grant Aid Per Year
$2775
44%
Average Federal Grant Aid Per Year
$5,561
Average Grant & Scholarship By Family Income
Income
Average Amount
< $30k
$13,085
$30k - $48k
$13,293
$48k - $75k
$10,736
$75k - $110k
$9,281
$110k+
$13,438
Total Needs Based Scholarships/Grants Total amount of grant or scholarship aid awarded to all undergraduates from the federal government, state/local government, the institution, and other sources known to the institution.
$1,008,000
Total Non-Need-Based Scholarships/Grants
$329,000
Student Loans
Students Borrowing Loans Loans to students - Any monies that must be repaid to the lending institution for which the student is the designated borrower. Includes all Title IV subsidized and unsubsidized loans and all institutionally- and privately-sponsored loans. Does not include PLUS and other loans made directly to parents.
50%
Average Loan Amount Per Year
$7,284
Average Debt at Graduation The median federal debt of undergraduate borrowers who graduated. This figure includes only federal loans; it excludes private student loans and Parent PLUS loans.
$9,166
Median Monthly Loan Payment The median monthly loan payment for student borrowers who completed, if it were repaid over 10 years at a 5.05% interest rate.
$130
Students receiving federal loans
50%
Average Federal Loans Per Year
$5,758
Average Other Loans Per Year
$21,609
Admissions
Key Admissions Stats
Institution Type
Private
- Not for Profit
- Coed
Need Blind
This school does not consider an applicant’s financial situation when deciding admission
Level of Institution
4 Year
Campus Setting
Small city
448
Students Applied
37%
Transfer Acceptance Rate
100
Transfer Students Admitted
Admissions Requirements
SAT
No
ACT
No
Transcript
Yes
Test Optional
Yes
SAT Subject Tests
Yes
AP Course Credit
Yes
Dual Enrollment
Yes
Important Deadlines
| Application Type | Application Deadline | Reply Deadline |
|---|---|---|
| Fall Regular Decision | September 23 | |
| Spring Regular Decision | March 4 | |
| Other | June 24 |
Application Fee
$50
Fee waivers availableApplications Accepted
Admitted Student Stats
In-State Students
51%
Out-Of-State Students
53%
20%
Submitting ACT
41%
Submitting SAT
Average ACT Composite: 20
0
36
Average SAT Composite: 1029
0
1600
SAT Percentiles
Math
25th
425
75th
530
Reading
25th
405
75th
587
3.2
Average GPA
Students Enrolled By GPA
3.75+
14%
3.50 - 3.74
16%
3.25 - 3.49
21%
3.00 - 3.24
18%
2.50 - 2.99
30%
2.00 - 2.49
1%
Admissions Resources
For International Student Services: visit page
For Students with Disabilities: visit page
For Veteran Services: visit page
Academics
Key Academic Stats
Highest Degree Offered
Doctorate
Total Number of Students
2,753
Total Number of Undergrads
915
0
100
14%
Graduate in 4 Years US National: 28%
0
100
28%
Graduate in 6 Years US National: 52%
Student:Faculty Ratio
13:1
US National: 21:1Non Traditional Learning
- Online Classes
- Online Undergrad Degrees
- Summer Sessions
- Combined Institution Double Degree Programs
- Some Programs Requires Co-Op/Internship
Classroom Sizes
2-19 Students
69%
20-39 Students
28%
40-99 Students
2%
Degrees and Majors
MAJORS
16
Majors
| A B M D | |
|---|---|
| BIOLOGICAL AND BIOMEDICAL SCIENCES | |
| BUSINESS, MANAGEMENT, MARKETING, AND RELATED SUPPORT SERVICES | |
| COMPUTER AND INFORMATION SCIENCES AND SUPPORT SERVICES | |
| CULINARY, ENTERTAINMENT, AND PERSONAL SERVICES | |
| FAMILY AND CONSUMER SCIENCES/HUMAN SCIENCES | ✓ ✓ |
| HEALTH PROFESSIONS AND RELATED PROGRAMS | |
| LIBERAL ARTS AND SCIENCES, GENERAL STUDIES AND HUMANITIES | |
| MULTI/INTERDISCIPLINARY STUDIES | |
| PSYCHOLOGY | |
| SOCIAL SCIENCES |
Faculty Overview
0
100
80%
Faculty With Terminal Degree US National: 36%
Gender
Male
Female
US National: 42%
US National: 48%
Ethnicity
African American
Asian/Pacific Islander
White
Hispanic
Multi-Racial
Campus Life
Key Campus Stats
Student Gender
Male
Female
51%
US National: 44%49%
US National: 56%Residency
In-State Students
51%
Out-Of-State Students
53%
Size of Town
Small city
US States Represented
52
Countries Represented
58
Ethnicity
African American
26%
Asian/Pacific Islander
3%
Hispanic
18%
Native American
2%
White
31%
Unknown
3%
Percent of First Generation Students
29%
Student Organizations
73
LGBTQIA Student Resource Groups
Yes
On Campus Women's Center
No
Cultural Student Resource Groups
Yes
Housing
0
100
10%
Undergrads Living on Campus
On-campus living required of freshman
No
Disability Housing Available
No
0
100
40%
Freshman Living on Campus
Athletics
Divisional Sports Nickname
Running Eagle
School Colors
green and gold
Varsity Athletics Association
NAIA
Varsity Athletics Conference Primary
Not applicable
Total Male Athletes
194
Total Female Athletes
153
Intramural Sports
8
Sports Club
1
Sports Team (Men)
- Basketball
- Bowling
- Cheerleading-Dance Team
- Rugby
- Soccer
- Swimming
- Volleyball
- Wrestling
Sports Team (Women)
- Basketball
- Bowling
- Cheerleading-Dance Team
- Cross Country
- Lacrosse
- Rugby
- Soccer
- Swimming
- Track and Field
- Volleyball
- Wrestling
Life University Athletics: visit page
Campus Safety
24-HR security patrol
Yes
Campus emergency phones
Yes
24-HR escort safety rides
No
Mobile campus emergency alert
Yes
After Graduation
Post Grad Stats
Average Salary
6 years after graduation
$47,200
Top 5 Cities
Atlanta
New York
Los Angeles
San Francisco
Miami
Top 5 Employers
Life University
The Joint Chiropractic
Chiropractor
100% Chiropractic
Microsoft
Top 5 Sectors
Business Development
Healthcare Services
Operations
Arts and Design
Media and Communication
Average Debt at Graduation The median federal debt of undergraduate borrowers who graduated. This figure includes only federal loans; it excludes private student loans and Parent PLUS loans.
$9,166
Loan Default Rate
6%
National: 8%
Median Monthly Loan Payment The median monthly loan payment for student borrowers who completed, if it were repaid over 10 years at a 5.05% interest rate.
$130
REVIEWS
Read What Students Are SayingDuring campus tour we were taken through three courses for a 15 minute sample to various courses that my program requires. The student/professor ratio seem conducive to an environment for learning.
Travis from Macon, GA
Great school with a great philosophy. Teachers and staff strive to give the students everything they need and create a great learning environment. It is a place where you can not only change your life but also the world.
Stephanie from Kennesaw, GA
Life University provides infinite avenues for advancement.
Life University values integrity and ensures it implementation.
Life University is full of LIFE!!!
Life University values integrity and ensures it implementation.
Life University is full of LIFE!!!
Doc from AL
As far as a chiropractic school, you will not find a better one. It is extremely hard academically, but considering you will be a doctor, it needs to be challenging. The faculty and staff are extremely friendly, and the school offers many opportunities to meet chiropractors.
Classes are small. Instructors work with struggling students. School is very much family oriented with a focus on holistic health.
Nancy from Marietta, GA
Similar Colleges
 Dahlonega, GA
 Albany, GA
 Atlanta, GA
 Atlanta, GA
 Athens, GA
 Kennesaw, GA
 Atlanta, GA
 Valdosta, GA
 Carrollton, GA
Life University