Overview


Pennsylvania State University-Penn State Shenango
Sharon, PA, USA
Public
4 Year
Overview
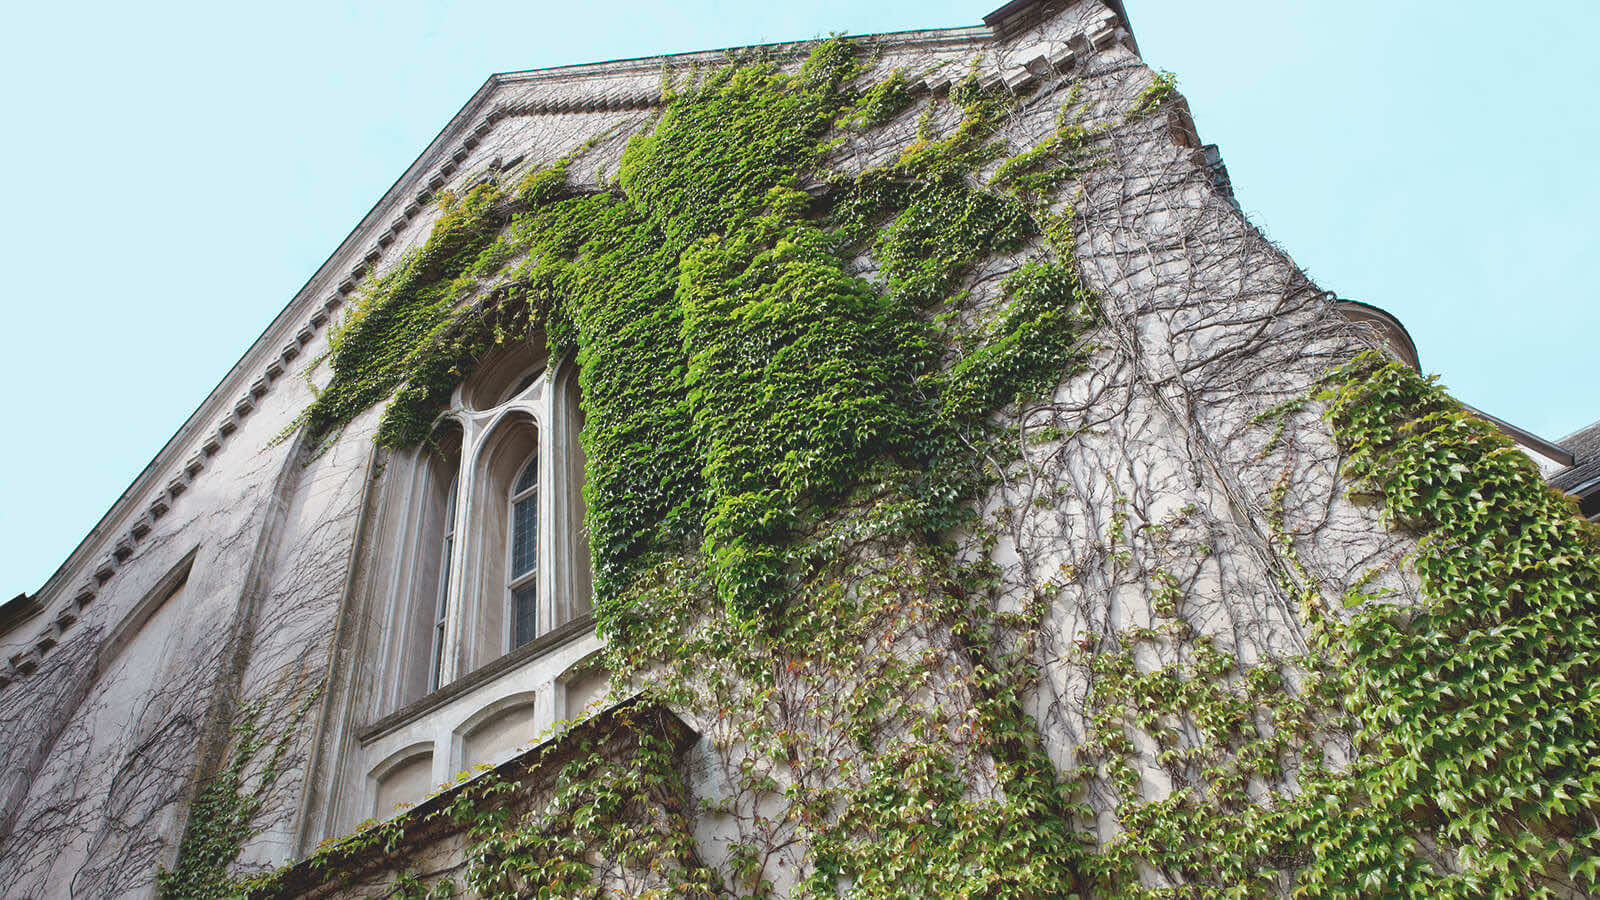
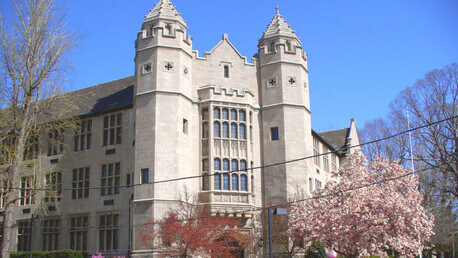
Penn State Shenango is a commonwealth campus of Penn State University in western Pennsylvania and the system’s only campus in an urban setting. The Shenango location offers six bachelor’s degree programs as well as the opportunity to begin classes in over 275 other Penn State majors before transferring to another campus for completion. Additionally, Penn State Shenango features a master’s degree in Nursing program with two concentrations. For students who wish to experience cultures outside of the United States, the university’s Alternative Spring Break provides an annual opportunity to embark upon a service project in a developing foreign country.
Acceptance Rate:
87%
Average Net Price:
$13,983
Campus Setting:
Suburb or town
Average GPA
3.1
Average ACT Composite
16
Average SAT Composite
989
Tuition, Cost & Aid
Affordability & Cost
Average Net Price
$13,983
Discover how military service can help you pay for college
Explore Military PathwaysTuition
| In-State Tuition In-state tuition is the tuition charged by institutions to those students who meet the state's or institution's residency requirements. In-district tuition is the tuition charged by the institution to those students residing in the locality in which they attend school and may be a lower rate than in-state tuition if offered by the institution. | $14,002 |
| Out-of-State Tuition Out-of-state tuition is the tuition charged by institutions to those students who do not meet the state’s or institution’s residency requirements. Out-of-district tuition is the tuition charged by the institution to those students not residing in the locality in which they attend school. | $23,310 |
Additional Costs
| Books and Supplies | $1840 |
Average Net Price By Family Income
Income
Average Amount
< $30k
$9,112
$30k - $48k
$17,107
$48k - $75k
$17,200
$75k - $110k
$22,848
$110k+
$24,551
Financial Aid: visit page
Aid & Grants
0
100
53%
Need Met
Students Receiving Gift Aid Percent of undergraduate students awarded federal gift aid. Federal gift aid includes any grant or scholarship aid awarded, from the federal government, a state or local government, the institution, and other sources known by the institution. Students Receiving Grants Percent of undergraduate students awarded grant aid. Grant aid includes any grant or scholarship aid awarded, from the federal government, a state or local government, the institution, and other sources known by the institution.
35%
Average Aid Per Year
$12,956
35%
Average Federal Grant Aid Per Year
$5,419
Average Institution Grant Aid Per Year
$7,219
Students receiving state aid Students receiving federal aid
46%
Average State Grant Aid Per Year
$3157
79%
Average Federal Grant Aid Per Year
$5,419
Total Needs Based Scholarships/Grants Total amount of grant or scholarship aid awarded to all undergraduates from the federal government, state/local government, the institution, and other sources known to the institution.
$2,229,695
Total Non-Need-Based Scholarships/Grants
$152,629
Student Loans
Students Borrowing Loans Loans to students - Any monies that must be repaid to the lending institution for which the student is the designated borrower. Includes all Title IV subsidized and unsubsidized loans and all institutionally- and privately-sponsored loans. Does not include PLUS and other loans made directly to parents.
63%
Average Loan Amount Per Year
$6,955
Average Debt at Graduation The median federal debt of undergraduate borrowers who graduated. This figure includes only federal loans; it excludes private student loans and Parent PLUS loans.
$19,500
Median Monthly Loan Payment The median monthly loan payment for student borrowers who completed, if it were repaid over 10 years at a 5.05% interest rate.
$247
Students receiving federal loans
56%
Average Federal Loans Per Year
$5,926
Average Other Loans Per Year
$9,731
Admissions
Key Admissions Stats
Institution Type
Public
- Not for Profit
- Coed
Need Blind
This school does not consider an applicant’s financial situation when deciding admission
Level of Institution
4 Year
Campus Setting
Suburb or town
192
Students Applied
59%
Transfer Acceptance Rate
36
Transfer Students Admitted
Admissions Requirements
SAT
No
ACT
No
Transcript
No
Test Optional
No
SAT Subject Tests
Yes
AP Course Credit
Yes
Dual Enrollment
Yes
Important Deadlines
| Application Type | Application Deadline | Reply Deadline |
|---|---|---|
| Early Action Acceptance is not binding, but student will receive admissions decision earlier. | November 1 |
Application Fee
$65
Fee waivers availableApplications Accepted
Admitted Student Stats
In-State Students
86%
Out-Of-State Students
23%
8%
Submitting SAT
Average ACT Composite: 16
0
36
Average SAT Composite: 989
0
1600
SAT Percentiles
Math
25th
455
75th
515
Reading
25th
445
75th
540
3.1
Average GPA
Students Enrolled By GPA
3.75+
5%
3.50 - 3.74
13%
3.25 - 3.49
28%
3.00 - 3.24
18%
2.50 - 2.99
22%
2.00 - 2.49
14%
Students Enrolled By Class Rank
Top 10%
20
Top 25%
30
Top 50%
65
Students Enrolled By Household Income
< $30k
8
$30k - $48k
3
$48k - $75k
5
$75k - $110k
5
$110k+
3
Admissions Resources
Admissions: visit page
Admissions Email: [email protected]
For Students with Disabilities: visit page
For Veteran Services: visit page
Academics
Key Academic Stats
Highest Degree Offered
Bachelor's
Total Number of Students
281
Total Number of Undergrads
281
0
100
14%
Graduate in 4 Years US National: 28%
0
100
20%
Graduate in 6 Years US National: 52%
Student:Faculty Ratio
6:1
US National: 21:1Non Traditional Learning
- Online Classes
- Online Undergrad Degrees
- Combined Institution Double Degree Programs
Learning Options
- Honors Program
Classroom Sizes
2-19 Students
76%
20-39 Students
22%
Degrees and Majors
MAJORS
10
Majors
| A B M D | |
|---|---|
| BUSINESS, MANAGEMENT, MARKETING, AND RELATED SUPPORT SERVICES | |
| COMPUTER AND INFORMATION SCIENCES AND SUPPORT SERVICES | |
| FAMILY AND CONSUMER SCIENCES/HUMAN SCIENCES | |
| HEALTH PROFESSIONS AND RELATED PROGRAMS | |
| HOMELAND SECURITY, LAW ENFORCEMENT, FIREFIGHTING AND RELATED PROTECTIVE SERVICES | |
| LIBERAL ARTS AND SCIENCES, GENERAL STUDIES AND HUMANITIES |
Faculty Overview
Gender
Male
Female
US National: 42%
US National: 48%
Ethnicity
African American
Asian/Pacific Islander
White
Hispanic
Unknown
Campus Life
Key Campus Stats
Student Gender
Male
Female
30%
US National: 44%70%
US National: 56%Residency
In-State Students
86%
Out-Of-State Students
23%
Size of Town
Suburb or town
Countries Represented
Ethnicity
African American
11%
Asian/Pacific Islander
1%
Hispanic
4%
White
59%
Multiracial
5%
Unknown
20%
Percent of First Generation Students
29%
LGBTQIA Student Resource Groups
No
On Campus Women's Center
No
Cultural Student Resource Groups
No
Housing
On-campus living required of freshman
No
Disability Housing Available
No
Athletics
Divisional Sports Nickname
lions
School Colors
blue and white
Varsity Athletics Association
NSCAA
Varsity Athletics Conference Primary
Not applicable
Intramural Sports
5
Sports Club
2
Campus Safety
24-HR security patrol
No
Campus emergency phones
No
24-HR escort safety rides
No
Mobile campus emergency alert
No
After Graduation
Post Grad Stats
Average Salary
6 years after graduation
$57,200
Average Debt at Graduation The median federal debt of undergraduate borrowers who graduated. This figure includes only federal loans; it excludes private student loans and Parent PLUS loans.
$19,500
Loan Default Rate
6%
National: 8%
Median Monthly Loan Payment The median monthly loan payment for student borrowers who completed, if it were repaid over 10 years at a 5.05% interest rate.
$247
Similar Colleges
- Erie, PA
- New Kensington, PA
- Altoona, PA
- Monaca, PA
- Middletown, PA
- Dubois, PA
- Hazleton, PA
 University Park, PA
- Mckeesport, PA
- Schuylkill Haven, PA
- York, PA
 Youngstown, OH
Pennsylvania State University-Penn State Shenango